

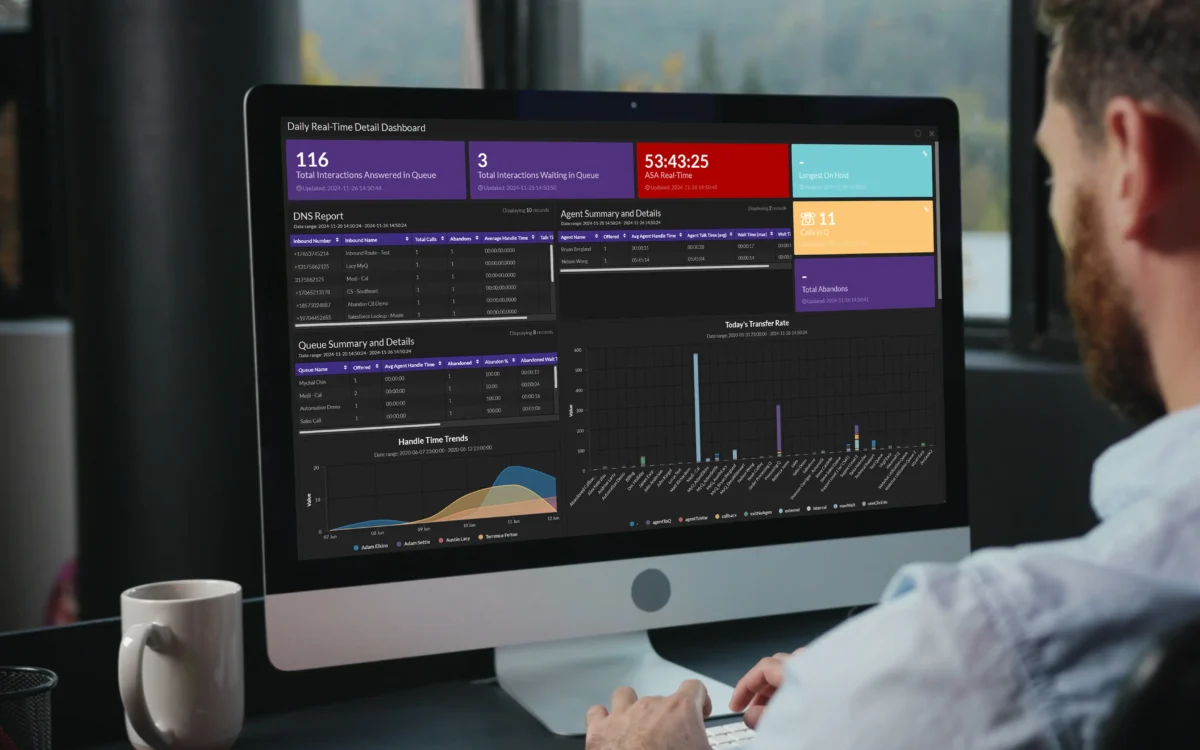
Quality Assurance Scores Meet Compliance: A CX Guide
How to architect one CX dashboard that satisfies both audit scrutiny and executive performance demands
Learn how to structure quality assurance scores, first contact resolution, and service level rate into a single dashboard framework. This guide shows regulated industries how to meet compliance mandates while proving the business value of agent-centric investments.
- Dual-mandate dashboards are the goal – Design your CX reporting to serve both compliance auditors (who need documented methodology and audit trails) and executives (who need revenue narratives), using the same underlying data rather than maintaining separate systems.
- Agent happiness is a leading indicator of revenue – The causal chain runs from agent satisfaction through quality assurance scores to first contact resolution to customer retention to revenue protection. Document each link with your own data, not just industry benchmarks.
- First contact resolution is your strongest bridge metric – With the cross-industry average at roughly 70%, every percentage point improvement correlates with gains in both customer satisfaction and employee satisfaction, making it the most efficient metric for connecting operations to outcomes.
- Quality assurance scores serve both audiences – When structured with calibrated methodology and documented scoring criteria, QA scores satisfy compliance requirements for process adherence while also predicting the operational performance that drives revenue.
- Start with one link in the chain – You don’t need the complete agent-to-revenue connection documented on day one. Pick one relationship (e.g., QA scores to FCR), prove it with your data, and build outward from there quarterly.
Guide Orientation: What This Guide Covers and Who It’s For
This guide connects two domains that most organizations treat as separate projects: the operational metrics your contact center tracks daily (quality assurance scores, first contact resolution, service level rate) and the revenue outcomes your executive team and compliance auditors need documented. By the end, you’ll understand how to structure a CX dashboard that serves both mandates simultaneously, translating agent happiness and performance data into a narrative that satisfies regulators and persuades CFOs.
This guide is built for compliance officers, CX directors, and IT decision-makers in regulated industries (finance, healthcare, telecom) who face a specific tension: your dashboards must withstand audit scrutiny while also proving the business value of agent-centric investments. If you’re drowning in metrics but struggling to tell a coherent story with them, this is for you.
We won’t cover basic metric definitions in isolation. Instead, we’ll show you how to architect the relationship between agent experience data and customer revenue signals so that a single reporting framework does double duty.
Why Connecting Agent Happiness to Revenue Matters Now
Contact centers today track an overwhelming volume of data. Research from MIT Sloan has noted that companies may monitor anywhere from 50 to 200 CX metrics. The problem isn’t a lack of information. It’s that most organizations have no coherent framework for connecting those metrics to the two audiences that matter most: auditors who need documented compliance, and executives who need proof of financial return.
The cost of getting this wrong runs in both directions. A dashboard built only for operational improvement will fail a compliance audit because it lacks the traceability, data lineage, and documentation auditors require. A dashboard built only for auditors will fail your leadership team because it buries the story of how agent investment drives customer retention and revenue growth under layers of procedural documentation.
Meanwhile, the competitive landscape has shifted. 80% of service professionals now track first call resolution, up from 51% in 2018. Operational KPIs are mainstream. The differentiator is no longer whether you track them, but whether you can prove they connect to outcomes that matter financially and regulatorily. Organizations that solve this dual-mandate problem gain a structural advantage: they can justify agent experience investments with revenue data while simultaneously producing audit-ready documentation from the same system.
Core Concepts: The Dual-Mandate Dashboard
The Two Audiences Problem
Every CX dashboard serves at least two audiences with fundamentally different needs. Compliance stakeholders need evidence of process adherence, data integrity, and regulatory conformity. Executive stakeholders need a narrative about business impact: how does what we spend on agents translate into customer retention, revenue protection, and growth?
Most teams build for one audience and retrofit for the other. This creates brittle systems that break under pressure from either side.
Leading vs. Lagging Indicators
A critical distinction: agent happiness metrics (engagement scores, satisfaction surveys, quality assurance scores) are leading indicators. They predict future performance. Customer revenue outcomes (retention rates, lifetime value, upsell conversion) are lagging indicators. They confirm past performance. The connection between them is where the story lives, and where most dashboards fail.
Quality Assurance Scores as a Bridge Metric
Quality assurance scores occupy a unique position. They reflect agent capability and adherence to process (which satisfies compliance), while also correlating with customer outcomes like first contact resolution and satisfaction (which satisfies executives). When structured correctly, QA scores become the connective tissue between your two audiences. The mistake is treating them as a standalone performance metric rather than as a bridge between agent experience and business results.
The Metrics Overload Trap
Tracking 50+ metrics doesn’t make you data-driven. It makes you data-burdened. The framework in this guide deliberately narrows focus to the metrics that serve both mandates, then shows you how to layer additional context only when it strengthens the connection between agent happiness and revenue.
The Framework: A Four-Layer Reporting Architecture
This guide uses a four-layer model for structuring your dashboard so that every metric serves both compliance documentation and executive storytelling. The layers build on each other sequentially.
- Layer 1: Agent Experience Foundation — Establish the leading indicators (agent satisfaction, QA scores, engagement data) that predict downstream outcomes.
- Layer 2: Operational Performance — Connect agent experience to operational metrics (first contact resolution, service level rate, average handle time) that demonstrate process effectiveness.
- Layer 3: Customer Outcome Translation — Map operational performance to customer-facing outcomes (CSAT, retention, effort scores) that bridge internal operations and external impact.
- Layer 4: Revenue and Compliance Documentation — Convert all three preceding layers into dual-purpose outputs: audit-ready documentation and executive revenue narratives.
Each layer feeds the next. Skip a layer, and you lose either the compliance thread or the revenue story. The following step-by-step breakdown shows you how to build each one.
Step-by-Step: Building the Connection Between Agent Happiness and Revenue
Step 1: Audit Your Current Agent Experience Data
Objective: Identify which agent-facing metrics you currently collect, where gaps exist, and whether your data collection methods meet compliance documentation standards.
Start by cataloging every agent-related metric your organization tracks. This includes quality assurance scores, agent satisfaction surveys (eSat), schedule adherence, coaching completion rates, and any internal engagement measures. For each metric, document three things: how it’s collected, how frequently it’s updated, and whether the collection method produces an auditable trail.
Most organizations discover that their agent data is scattered across multiple systems with inconsistent collection intervals. An eSat survey might run quarterly while QA scores update weekly, making it impossible to correlate the two in a meaningful timeframe. The goal here is not to add more metrics but to understand the integrity and cadence of what you already have.
Anti-patterns to avoid: Don’t assume that having data means having usable data. A QA scoring system that lacks calibration documentation won’t survive an audit, even if the scores themselves are accurate. Similarly, don’t conflate agent satisfaction with agent engagement. Satisfaction measures how agents feel; engagement measures what they do. Both matter, but they answer different questions.
Success indicators: You can produce a single document listing every agent experience metric, its source system, collection frequency, and audit readiness status. If gaps exist, they’re explicitly identified rather than hidden.
Step 2: Establish Your Operational Performance Baseline
Objective: Create a documented baseline for the operational metrics that connect agent experience to customer outcomes, with particular attention to first contact resolution and service level rate.
First contact resolution is the most powerful operational metric for this framework because it correlates with both agent satisfaction and customer revenue outcomes. SQM Group reports that a 1% improvement in FCR drives a 1% improvement in customer satisfaction and a 1% to 5% increase in employee satisfaction. This bidirectional relationship makes FCR the strongest bridge between your agent experience layer and your customer outcome layer.
The cross-industry average FCR rate sits at approximately 70%, meaning roughly 3 in 10 customer issues require follow-up contact. Healthcare organizations tend to cluster near 71% due to regulatory complexity, while e-commerce operations may reach 75% to 85%. Knowing where your organization falls relative to industry benchmarks gives your executive audience context and gives your compliance audience a documented standard.
However, traditional FCR measurement has well-documented limitations. Sharpen has written extensively about how Active Contact Resolution (ACR) can serve as a more practical agent-level metric because it measures callback rates within a set timeframe rather than relying on customer self-reporting. For compliance purposes, ACR produces a cleaner audit trail because it’s system-generated rather than survey-dependent.
Anti-patterns to avoid: Don’t baseline your metrics using a single month’s data. Seasonal variation, staffing changes, and product launches all distort short-term measurements. Use a minimum of three months, ideally six, to establish a defensible baseline. Also avoid treating service level rate (the percentage of calls answered within a target timeframe) as a quality metric. It’s a capacity metric. High service level rates with poor FCR simply mean you’re answering calls quickly without resolving them.
Success indicators: You have a documented baseline for FCR, service level rate, and at least two additional operational metrics, with enough historical data to identify trends rather than snapshots.
Step 3: Map Operational Metrics to Customer Revenue Signals
Objective: Establish documented, defensible connections between your operational performance metrics and the customer outcomes that drive revenue.
This is where most dashboards fail. They present operational metrics and customer revenue outcomes side by side without establishing causation or even meaningful correlation. Your CFO doesn’t care that FCR improved by 4% unless you can show what that improvement meant in retained revenue, reduced cost-to-serve, or increased customer lifetime value.
Start with the most direct connection: repeat contacts. Every customer issue that isn’t resolved on first contact generates additional cost (agent time, telephony charges, system resources) and additional risk (customer frustration, potential complaint escalation, regulatory exposure in regulated industries). If your FCR moves from 70% to 74% on a volume of 10,000 monthly contacts, that’s 400 fewer repeat interactions. Multiply by your cost-per-contact, and you have a revenue protection number your CFO can use.
Then layer in the customer satisfaction connection. Traditional CSAT scores can mask churn risk because a customer might rate an interaction as “satisfactory” while still deciding to leave. The more reliable signal is the combination of resolution data and effort data: did we solve the problem, and how hard did the customer have to work? When you connect these to retention rates, you move from operational reporting to revenue storytelling.
Anti-patterns to avoid: Don’t claim direct causation without longitudinal data. Saying “FCR improvement caused revenue growth” requires controlling for other variables. Instead, frame the relationship as a documented correlation with supporting evidence. Auditors respect intellectual honesty; executives respect it even more. Also resist the temptation to use Net Promoter Score as your primary revenue proxy. NPS measures intent, not behavior, and its predictive validity for actual revenue outcomes is contested.
Success indicators: You can articulate, in plain language, how a specific change in an operational metric (e.g., FCR improving by 3 points) translates to a specific financial outcome (e.g., $X in reduced repeat-contact costs and Y% improvement in 90-day retention). The methodology is documented and auditable.
Step 4: Build the Agent Happiness-to-Revenue Causal Chain
Objective: Document the specific mechanisms by which agent experience improvements flow through to revenue outcomes, creating a narrative that satisfies both compliance documentation requirements and executive ROI questions.
This is the step that almost no one in the industry addresses well. The causal chain works like this: happier, better-supported agents produce higher quality assurance scores. Higher QA scores correlate with better first contact resolution. Better FCR reduces customer effort and repeat contacts. Reduced effort improves satisfaction and retention. Improved retention protects and grows revenue.
Each link in this chain needs to be documented with your organization’s own data, not just industry benchmarks. Pull your QA scores for the past six months alongside your eSat data for the same period. Do agents with higher satisfaction scores also produce higher QA scores? In most organizations, the answer is yes, but the strength of the correlation varies. Document the relationship, including its limitations.
Then connect QA scores to FCR. Agents who score well on quality assessments (proper issue identification, complete resolution, accurate documentation) typically resolve issues on first contact more often. This connection is where platforms like Sharpen can provide structural support, since their agent-first design surfaces the coaching and performance data needed to make this link visible and measurable rather than assumed.
For compliance purposes, this causal chain serves as your process documentation. It shows auditors that your metrics aren’t arbitrary but are connected through a documented logic that traces from agent inputs to customer outcomes. For executive purposes, the same chain becomes your investment thesis: spending on agent experience isn’t a cost center, it’s a revenue protection mechanism with measurable returns.
Anti-patterns to avoid: Don’t skip links in the chain. Jumping directly from “agent happiness” to “revenue” without showing the intermediate steps invites skepticism from both auditors and executives. Also don’t over-engineer the analysis. A clear correlation documented with honest caveats is more credible than a complex model that claims false precision.
Success indicators: You have a documented causal chain with your organization’s own data supporting each link. The chain can be presented as a one-page visual for executives and as a detailed methodology document for auditors.
Step 5: Structure Your Dashboard for Dual-Mandate Reporting
Objective: Design a single dashboard architecture that produces both compliance-ready documentation and executive-ready revenue narratives without maintaining two separate systems.
The practical structure that works for most regulated organizations is a three-tier dashboard. The top tier shows the executive summary: revenue impact metrics (retained revenue, cost-per-resolution trends, customer lifetime value movement) with clear attribution to operational improvements. The middle tier shows the operational story: key contact center KPIs like FCR, service level rate, QA scores, and call abandonment rate, trended over time with annotations explaining significant changes. The bottom tier contains the compliance layer: data lineage documentation, collection methodology notes, calibration records, and audit trail references.
The key design principle is that each tier references the others. When an executive asks “why did retained revenue improve this quarter?” the answer traces down through operational metrics to specific agent experience initiatives. When an auditor asks “how do you validate this FCR number?” the answer traces down to documented collection methodology and calibration records.
Build annotations into your dashboard, not as optional commentary but as required fields. Every significant metric movement should include a brief explanation of contributing factors. This serves compliance (documented context for data changes) and executives (narrative coherence) simultaneously.
Anti-patterns to avoid: Don’t build separate dashboards for separate audiences. The moment you maintain two systems, they diverge, and the divergence creates both compliance risk and credibility risk. Also avoid real-time dashboards for executive reporting. Executives need trended, contextualized data, not live feeds. Real-time views belong in the operational tier for team leads and supervisors.
Success indicators: A single dashboard system can produce an audit-ready export and a board-ready presentation from the same underlying data, with no manual reconciliation required.
Step 6: Tell the Story to Non-Technical Stakeholders
Objective: Translate your dual-mandate dashboard into narratives that resonate with CFOs, board members, and compliance committees who don’t think in contact center terminology.
The framework for presenting customer service metrics to executives requires three elements: a problem statement grounded in business risk, a measurement approach that connects to financial outcomes, and a progress narrative that shows trajectory rather than snapshots.
For your CFO, the story sounds like this: “Our agents resolved 74% of customer issues on first contact this quarter, up from 70% last quarter. That 4-point improvement eliminated approximately 400 repeat contacts per month, saving $X in direct operational cost and reducing customer effort in ways that correlate with a Y% improvement in 90-day retention. The agent experience investments we made (coaching programs, tool improvements, workload balancing) are the documented driver of this improvement.”
For your compliance committee, the same data tells a different but compatible story: “Our quality assurance scoring methodology is calibrated monthly, with inter-rater reliability documented at Z%. Our FCR measurement uses system-generated callback tracking within a 7-day window, producing an auditable record for every interaction. All metric collection methods are documented in our process library with version control.”
Notice that both stories use the same data. The difference is framing, emphasis, and vocabulary. This is why the dual-mandate dashboard works: it doesn’t require different data, just different lenses on the same data.
Anti-patterns to avoid: Don’t lead with metrics when talking to executives. Lead with the business outcome, then support it with metrics. Conversely, don’t lead with narrative when talking to auditors. Lead with methodology, then show the outputs. Also avoid the temptation to present every metric you track. Select the 3 to 5 metrics that tell the clearest story along your causal chain and go deep on those rather than going wide on everything.
Success indicators: Your CFO can explain, in their own words, how agent experience investment connects to revenue protection. Your compliance officer can point to a single system of record that satisfies audit documentation requirements.
Practical Examples: Dual-Mandate Reporting in Action
Scenario: A Healthcare Contact Center Under HIPAA Audit
A mid-size healthcare payer tracks QA scores, FCR, and agent satisfaction across 200 agents. During a HIPAA audit, the compliance team needs to demonstrate that patient interactions are handled according to documented protocols. Their QA scoring rubric includes HIPAA-specific criteria (identity verification, PHI handling, disclosure documentation), and every scored interaction is stored with a complete audit trail.
Simultaneously, the VP of Operations needs to justify a $500K investment in agent coaching technology to the CFO. Using the same QA data, they show that agents who completed the coaching program improved their QA scores by 12%, which correlated with a 5-point FCR improvement. That FCR improvement, applied to their monthly volume, eliminated approximately 1,200 repeat calls per quarter, saving an estimated $180K annually in direct costs while improving member satisfaction scores by 3 points.
One dataset. Two stories. Both credible because the underlying architecture was designed to serve both from the start.
Scenario: A Financial Services Firm Facing PCI-DSS Requirements
A regional bank’s contact center handles payment-related inquiries subject to PCI-DSS. Their dashboard tracks service level rate (calls answered within 30 seconds) alongside agent engagement scores and customer effort measurements. For PCI-DSS purposes, every interaction involving payment data is flagged, and QA reviews of those interactions are documented with specific compliance criteria.
For the board, the same data tells a retention story. Customers who experienced low-effort interactions (resolved quickly, no transfers, no callbacks) showed 23% higher product adoption rates over the following quarter compared to customers with high-effort experiences. The agent engagement data showed that engaged agents produced lower-effort interactions at twice the rate of disengaged agents, creating a clear investment case for agent experience programs.
Common Mistakes and Pitfalls
The most predictable failure is treating this as a technology project rather than a design problem. No dashboard tool will solve a poorly structured metric architecture. If your metrics don’t connect logically from agent experience through operations to revenue, no visualization will create that connection.
A second common mistake is over-indexing on customer-facing metrics while neglecting agent-facing ones. Organizations that track CSAT and NPS religiously but ignore agent satisfaction are measuring the symptom while ignoring the cause. The research is clear: a 1% FCR improvement can drive a 1% to 5% increase in employee satisfaction, and the relationship flows in both directions.
Third, teams frequently build dashboards that answer “what happened” but not “why it matters.” A compliance audit doesn’t just want to see your numbers. It wants to see your methodology. An executive doesn’t just want to see your FCR rate. They want to see what it means for the business. Build the “so what” into every metric you display.
Finally, resist the urge to wait for perfect data. Your causal chain will have gaps and limitations, especially in the early stages. Document those limitations honestly. Partial, well-documented insight is infinitely more valuable than comprehensive data with no narrative structure.
What to Do Next
Start with Step 1. Audit your current agent experience data and document what you have, what’s missing, and what isn’t audit-ready. This single exercise will reveal whether your organization is building on solid ground or on assumptions.
Then pick one link in the causal chain (agent satisfaction to QA scores, or QA scores to FCR, or FCR to retention) and document it with your own data. You don’t need the complete chain to start telling a better story. One well-documented connection is more persuasive than a dozen assumed ones.
Revisit this framework quarterly as your data matures. The connections between agent happiness and revenue outcomes will sharpen over time as you accumulate longitudinal evidence. Use this guide as a reference architecture, not a one-time checklist. The organizations that do this well treat it as an evolving practice, not a finished project.
Frequently Asked Questions
What are the key CX metrics for contact centers that serve both compliance and executive audiences?
The most versatile metrics are quality assurance scores, first contact resolution (or Active Contact Resolution), and service level rate. These three metrics can be structured to document process adherence for auditors while simultaneously connecting to revenue outcomes for executives. The key is building documented methodology around each metric so it withstands audit scrutiny while also mapping to financial impact through a clear causal chain.
How can I improve my contact center’s first contact resolution rate?
FCR improvement starts with agent enablement, not process enforcement. Agents who have access to complete customer context, clear escalation paths, and adequate decision-making authority resolve issues on first contact more consistently. Coaching programs that target the root causes of repeat contacts (incomplete information gathering, unclear resolution criteria, system limitations) tend to produce more durable FCR improvements than simply measuring and pressuring agents on the number.
Why is measuring customer satisfaction important in a contact center, and why isn’t it enough?
Customer satisfaction measurement captures how customers perceive their experience, which matters for retention and loyalty. However, CSAT alone is insufficient because it’s a lagging indicator that doesn’t explain why satisfaction changed or what operational levers to pull. Connecting CSAT to leading indicators like agent QA scores and engagement data gives you both the diagnostic power to improve and the documentation trail that compliance requires.
Which metrics should I track to assess agent performance in a contact center?
Focus on metrics that connect to both agent development and business outcomes: quality assurance scores (calibrated with documented methodology), Active Contact Resolution or FCR, agent satisfaction or engagement scores, and coaching completion rates. Avoid over-relying on efficiency metrics like average handle time in isolation, as they incentivize speed over resolution quality and can undermine both customer outcomes and compliance adherence.
What is the impact of customer effort score on customer loyalty?
Customer effort score measures how hard a customer had to work to get their issue resolved. Lower effort consistently correlates with higher retention and greater willingness to expand the relationship. For dashboard design purposes, effort score is valuable because it bridges the gap between operational metrics (FCR, transfer rate, hold time) and revenue outcomes (retention, lifetime value), making it a strong candidate for your dual-mandate reporting framework.
How do I present contact center metrics to a CFO or board who aren’t familiar with CX terminology?
Lead with the business outcome, not the metric. Instead of saying “FCR improved by 4 points,” say “We eliminated 400 repeat customer contacts per month, saving $X in operational cost and correlating with improved customer retention.” Then use the metric as supporting evidence. Frame every data point in terms of revenue protected, cost avoided, or risk reduced. Keep the presentation to 3 to 5 connected metrics rather than a comprehensive dashboard tour.
Sources
- https://www.salesforce.com/service/contact-center/first-call-resolution/
- https://www.sqmgroup.com/resources/library/blog/fcr-metric-operating-philosophy
- https://sharpencx.com/evaluating-first-contact-resolution/
- https://sharpencx.com/customer-satisfaction-metrics-a-guide-to-what-they-miss/
- https://www.sharpencx.com
- https://sharpencx.com/ultimate-guide-contact-center-kpis/
- https://sharpencx.com/customer-service-metrics-for-contact-center-roi/